School of Psychological Sciences
Building knowledge and understanding of human behaviour and how the mind and brain work to improve people’s lives
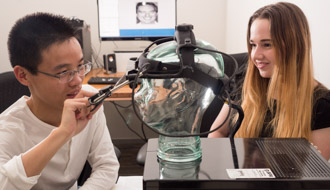
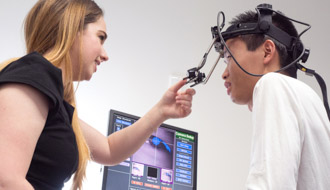
The School of Psychological Sciences has international recognition for excellence in teaching and research. Our multi-award-winning and research-led teaching provides students with a diverse set of skills and a unique hands-on learning experience for enhanced employability. Our research is cutting-edge with strong engagement across industries and the community.